|
Health Check |

|

|
|
|
Health Check |
|
|
Health Check
|
Health Check |
|
|
|
|
Health Check |
|
|
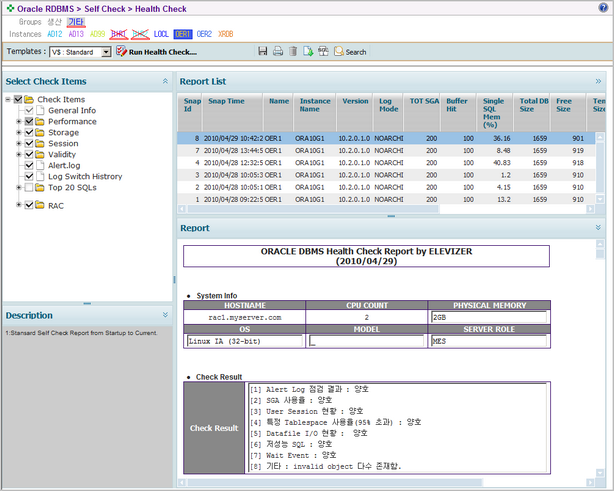
등록된 인스턴스에 대하여 Health check 를 수행할수 있으며, 수행된 결과는 Repository DB에 XML 령태로 저장이 되어 언제든 조회가 가능하다.
우측 상단의 Report List 영역에서 주요 항목에 대한 측정값을 확인할수 있고, 세부 보고서를 얻기 위해서는 해당 행을 클릭한다.
RAC 의 경우 아이템 선택 트리에서 RAC 부분이 자동으로 활성화 된다.
| □ | 화면 |
| □ | 특징 |
| • | DB 의 현재상태를 복잡한 스텝 없이 단 한번의 클릭으로 많은 정보를 얻을수 있다. |
| • | ELEVISOR 의 Health Check 는 단순한 HTML 형태의 출력물이 아닌 XML 문서이다. 따라서 저장된 데이타를 기반으로 추이등을 확인할수 있고, 향후 지원될 PDF 로의 전환이 가능하다. |
| • | Health Check 에서 사용된 모든 SQL 을 단번에 확인이 가능하며, sqlplus 또는 기타 툴을 이용하여 세부 정보를 확인할수 있도록 편의를 제공하였다. |
| • | 점검 결과 특이 사항이 없는 부분의 정보는 과감하게 삭제를 하고 , 특이 사항이 있는 부분만을 출력함으로써 문서의 가독성을 최대한 고려하였다. |
| • | v$ 기반의 기동이후 현재까지의 성능 정보외에도 awr 에서의 정보추출을 제공함으로써 최근 성능에 대한 신뢰도를 높였다. |
| □ | 조회 절차 |
| • | 조회하고자 하는 인스턴스를 선택한다. |
| • | Run Health check" 버튼을 클릭하면 Health check가 수행된다. |
| • | 만약 조회만 하고자 한다면 조회 버튼을 클릭하여 조회한다. |
| □ | 조회 절차 |
툴바 아이콘 |
설명 |
|
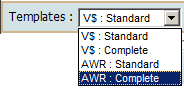
기본적으로 네가지 템플릿을 제공한다.
V$ : Standard - v$ 를 기본으로 한 Health Check (SQL 성능 정보 제외) V$ : Complete - v$ 를 기본으로 한 Health Check (SQL 성능 정보 포함) AWR : Standard - AWR 을 기본으로 한 Health Check(SQL 성능 정보 제외) AWR : Complete - AWR 을 기본으로 한 Health Check(SQL 성능 정보 포함) |
|
Health Check 를 수행한다. (최대 1분 정도 소요)
|
|
Check Result 및 점검자, Physical Memory 등을 입력한후 내용을 저장 한다 |
|
화면상의 그리드를 출력한다 |
|
선택된 행을 삭제한다. |
|
선택된 점검 리포트를 PC 로 다운로드 한다 |
|
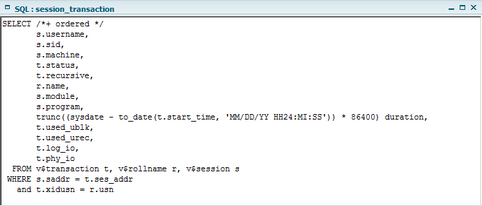
왼쪽 트리에서 선택된 점검에 사용된 항목 관련한 SQL 을 개별적으로 확인한다. 클릭시 다음과 같이 SQL 이 팝업 된다.
TIP : 점검 항목을 더블클릭 했을때도 동일한 결과를 얻을 수 있다.
|
|
해당 인스턴스의 점검 보고서를 그리드로 조회 한다. |
| □ | 점검 항목 |
항목
|
설명
|
General Info |
인스턴스의 일반적인 정량 정보를 포함하는 37개 항목 측정 결과 |
Performance |
|
General Metric |
대표적인 DB 성능 지표 대비 현재 상태 |
Resource Limit |
Resource 할당대비 현재 또는 최대값, 80% 기준 WARNING 출력 |
Single SQL Memory |
1회성 SQL의 메모리 점유율을 나타냅니다 |
Load Profile |
데이타베이스의 전반적인 처리량을 가늠할수 있는 스칼라 정보 |
Top 10 Wait Event |
대기 이벤트 발생 정보 |
Storage |
|
Tablespace Warnings |
90% 이상 사용중인 테이블 스페이스 |
Top 10 Datafile I/O |
데이타 화일의 I/O Top 10 |
Top 10 Hot Segments |
I/O 를 많이 발생하고 있는 세그먼트 리스트 Top 10 |
Session |
|
Current Session Stat. |
현재 세션의 전반적인 통계 |
Active Session |
10초 이상 ACTIVE 상태인 세션 |
Transaction |
현재 활성화된 트랜잭션 |
Lock |
LOCK 상태 |
Validity |
|
invalid_object |
비 가용상태의 오브젝트 리스트 |
Unusable Index |
사용할수 없는 상태의 인덱스 |
Invalid Component |
현재 상태가 invalid 이거나 마스터 버젼이 데이타베이스 서버 버젼과 다른 컴포넌트 정보 |
Other Seg. in System Area |
SYSTEM / SYSAUX 테이블 스페이스에 저장되어 있는 사용자 세그먼트 |
Alert.log |
최근 7일간 ALERT.LOG Error 발생 현황 |
Log Switch Histrory |
|
Top 20 SQLs |
|
TOP 20 SQL |
메모리 읽기량, 단위 수행당 메모리 읽기 량, 단위 수행당 응답시간 기준의 세가지 형태의 저성능 SQL Top 20 |
RAC |
|
Waiting Sessions |
The entries that are shown at the top are the sessions that have waited the longest amount of time that are waiting for non-idle wait events (event column). You can research and find out what the wait event indicates (along with its parameters) by checking the Oracle Server Reference Manual or look for any known issues or documentation by searching Metalink for the event name in the search bar. Example (include single quotes): [ 'buffer busy due to global cache' ]. Metalink and/or the Server Reference Manual should return some useful information on each type of wait event. The inst_id column shows the instance where the session resides and the SID is the unique identifier for the session (gv$session). The p1, p2, and p3 columns will show event specific information that may be important to debug the problem. To find out what the p1, p2, and p3 indicates see the next section. Items with wait_time of anything other than 0 indicate we do not know how long these sessions have been waiting. |
Event Parameter Lookup |
This section will give a description of the parameter names of the events seen in the last section. p1text is the parameter value for p1 in the WAITING SESSIONS section while p2text is the parameter value for p3 and p3 text is the parameter value for p3. The parameter values in the first section can be helpful for debugging the wait event. |
Ges Lock Blockers |
This section will show us any sessions that are holding locks that are blocking other users. The inst_id will show us the instance that the session resides on while the sid will be a unique identifier for the session. The grant_level will show us how the GES lock is granted to the user. The request_level will show us what status we are trying to obtain. The lockstate column will show us what status the lock is in. The last column shows how long this session has been waiting. |
Ges Lock Waiters |
This section will show us any sessions that are waiting for locks that are blocked by other users. The inst_id will show us the instance that the session resides on while the sid will be a unique identifier for the session. The grant_level will show us how the GES lock is granted to the user. The request_level will show us what status we are trying to obtain. The lockstate column will show us what status the lock is in. The last column shows how long this session has been waiting. |
Local Enqueues |
This section will show us if there are any local enqueues. The inst_id will show us the instance that the session resides on while the sid will be a unique identifier for. The addr column will show the lock address. The type will show the lock type. The id1 and id2 columns will show specific parameters for the lock type. |
Latch Holders |
If there is latch contention or 'latch free' wait events in the WAITING SESSIONS section we will need to find out which proceseses are holding latches. The inst_id will show us the instance that the session resides on while the sid will be a unique identifier for. The username column will show the session's username. The os_user column will show the os user that the user logged in as. The name column will show us the type of latch being waited on. You can search Metalink for the latch name in the search bar. Example (include single quotes): [ 'library cache' latch ]. Metalink should return some useful information on the type of latch. |
Latch Stats |
This view will show us latches with less than optimal hit ratios. The inst_id will show us the instance for the particular latch. The latch_name column will show us the type of latch. You can search Metalink for the latch name in the search bar. Example (include single quotes): [ 'library cache' latch ]. Metalink should return some useful information on the type of latch. The hit_ratio shows the percentage of time we successfully acquired the latch. |
Latch Stats(No-Wait) |
No-Wait Latch Only |
Global Cache CRPerformance |
This shows the average latency of a consistent block request. AVG CR BLOCK RECEIVE TIME should typically be about 15 milliseconds depending on your system configuration and volume, is the average latency of a consistent-read request round-trip from the requesting instance to the holding instance and back to the requesting instance. If your CPU has limited idle time and your system typically processes long-running queries, then the latency may be higher. However, it is possible to have an average latency of less than one millisecond with User-mode IPC. Latency can be influenced by a high value for the DB_MULTI_BLOCK_READ_COUNT parameter. This is because a requesting process can issue more than one request for a block depending on the setting of this parameter. Correspondingly, the requesting process may wait longer. Also check interconnect badwidth, OS tcp settings, and OS udp settings if AVG CR BLOCK RECEIVE TIME is high |
Global Cache Lock Performance |
This shows the average global enqueue get time. Typically AVG GLOBAL LOCK GET TIME should be 20-30 milliseconds. the elapsed time for a get includes the allocation and initialization of a new global enqueue. If the average global enqueue get (global cache get time) or average global enqueue conversion times are excessive, then your system may be experiencing timeouts. See the 'WAITING SESSIONS', 'GES LOCK BLOCKERS', GES LOCK WAITERS', and 'TOP 10 WAIT EVENTS ON SYSTEM' sections if the AVG GLOBAL LOCK GET TIME is high. |
Lock Conversion Detail |
This view shows the types of lock conversion being done on each instance. |
Top 10 Write Pinging Objects |
This view shows the top 10 objects for write pings accross instances. The inst_id column shows the node that the block was pinged on. The name column shows the object name of the offending object. The file# shows the offending file number (gc_files_to_locks). The STATUS column will show the current status of the pinged block. The READ_PINGS will show us read converts and the WRITE_PINGS will show us objects with write converts. Any rows that show up are objects that are concurrently accessed across more than 1 instance. |
Top 10 Read PingingObjects |
This view shows the top 10 objects for write pings accross instances. The inst_id column shows the node that the block was pinged on. The name column shows the object name of the offending object. The file# shows the offending file number (gc_files_to_locks). The STATUS column will show the current status of the pinged block. The READ_PINGS will show us read converts and the WRITE_PINGS will show us objects with write converts. Any rows that show up are objects that are concurrently accessed across more than 1 instance. |
Top 10 False Pinging Objects |
This view shows the top 10 objects for false pings. This can be avoided by better gc_files_to_locks configuration. The inst_id column shows the node that the block was pinged on. The name column shows the object name of the offending object. The file# shows the offending file number (gc_files_to_locks). The STATUS column will show the current status of the pinged block. The READ_PINGS will show us read converts and the WRITE_PINGS will show us objects with write converts. Any rows that show up are objects that are concurrently accessed across more than 1 instance. |